Every football fan has heard it: “They haven’t beat anyone.”
It’s the go-to dismissal of a team with a good record and a weak schedule. But who has the time to back that up with quantifiable data? Well, as it turns out, I do.
PageRank 101
Let’s start with a brief internet history lesson.
Some of you may remember Yahoo.com. Some of you may even remember the yodel. You could find whatever you wanted on Yahoo! This is because Yahoo paid a bunch of humans to manually index the internet, tagging what pages were important and which ones were not, by hand.
As you can imagine, that isn’t terribly efficient, and as the internet started to explode in size and complexity during the late 90s and early 2000s, their solution didn’t scale.
Enter Google and their revolutionary PageRank algorithm.
Rather than relying on humans to index the entire internet with subjective judgement calls regarding a webpage’s “relevance” to any given keyword, what if you could instead determine a webpage’s keyword relevance by analyzing the topology of the internet itself with computers?
In the original Brin & Page paper, PageRank achieves this by modeling the internet as an interconnected graph of nodes (webpages) and edges (links) that share a fixed amount of “votes” or “influence”. It then iteratively “walks the graph” and redistributes the love. Its path is influenced by the number of links pointing to a node and the importance of where those links come from.
You can do this in any domain if you are able to model it as a graph in a way that encodes a network of influence. You can also add weights to the edges, signaling to the algorithm that some node-to-node connections are more important than others. In our graph, we do precisely this by weighing each game result by the margin of victory. Blowouts matter.
By treating football teams like Google treats webpages, we can rank them the same way — by quantity (wins) and quality (who).
For example, in Google Search, a few links from the New York Times are worth more than many from MedcalfSoftwareSolutions.com. Likewise, in the 2025 NFL season, two blowout wins over the New York Jets are worth less than one comeback win over the Seattle Seahawks.
The NFL PageRank Graph(s)
So…I actually have 50 graphs. 2 graphs for each of the last 25 seasons.
Each graph below is a snapshot of a given season at a distinct point in time, going back to 2001.
The distinct points in time
- Reg Season: Only include regular season games.
- Reg + Playoffs (thru Conf): Where we are at time of writing, Feb 6 2026, 2 days before the Super Bowl. Teams continue to collect influence by beating good playoff teams.
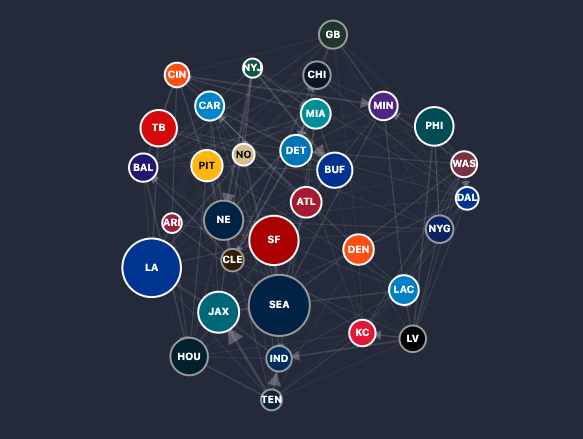
Interpreting a Season’s PageRank Graph
Each node is a team, and each edge represents a game result weighted by the margin of victory. Votes, influence, credit, whatever you want to call it, flow to the victor. When a team loses to another team, they give away their influence proportional to the margin of victory.
Run PageRank across the graph, and you get a power ranking for that season that accounts for transitive strength of schedule — not just who you beat, but who they beat, and who they beat, all the way through the league.
Can PageRank predict Super Bowls?
Sort of. Using regular season data alone, the model picks the higher-ranked Super Bowl team as the winner. It gets it right 46% of the time (11 of 24). That’s essentially a coin flip.
But add playoff results through the conference championship, and it jumps to 67% (16 of 24). That’s not because playoff PageRank is a better power ranking — it’s arguably worse, since teams haven’t played the same number of games. Teams that advance further have more opportunities to accumulate PageRank, so the ranking is inherently biased toward deeper playoff runs. But as a prediction tool, the extra signal from playoff wins against good teams is clearly useful.
How does that compare?
For a model that only knows point margins and graph structure — no rosters, no injuries, no home field — 67% holds up surprisingly well:
- Vegas favorites win the Super Bowl about 65% of the time (37-20 all-time). That’s the entire sports betting market’s collective wisdom, and PageRank is within three points of it.
- ESPN’s FPI and FiveThirtyEight’s Elo both report 65-73% accuracy.
PageRank is essentially matching the house on the biggest game of the year, using nothing but the shape of the graph.
The 2007 Patriots broke the algorithm
This is my favorite finding.
The 2007 Patriots went 16-0. Undefeated. In the LOST-TO graph, edges flow from losers to winners. The Patriots never lost — so they have zero outgoing edges. They’re what graph theory calls a sink node. Score flows in, nothing flows out.
In Brin and Page’s original PageRank paper, this is handled explicitly: you redistribute the dangling node’s score evenly to all other nodes each iteration. It’s like the random walker hitting a dead end and teleporting somewhere else.
Neo4j’s Graph Data Science library skips this step. It’s a performance optimization — sink nodes are rare in most real-world graphs. Web pages almost always link somewhere.
But an undefeated football team? That’s a natural sink. And the result is dramatic: the total PageRank across all 32 teams in 2007 sums to ~9 instead of ~32. More than 70% of the league’s score just disappeared into the Patriots black hole.
Every other 32-team season in the dataset sums to ~32. The 2007 Patriots literally broke Neo4j’s PageRank.
The inverse doesn’t break anything
You’d think the 2008 Lions (0-16) would cause the opposite problem. They’re a pure source node — 16 outgoing edges, zero incoming. They lost to everyone and beat nobody.
But the 2008 season total is a perfectly normal ~32. Source nodes don’t trap score; they pump it into the system. The Lions just get the minimum teleportation baseline (~0.05) and rank dead last. They’re actually good for the graph — feeding score to everyone who beat them.
The asymmetry is elegant: sinks break PageRank, sources don’t.
The findings
The 2004 Ravens were 9-7 and ranked #1 — with the highest regular season PageRank in the dataset. A score of 5.44, more than five times the league average. How? They beat the 15-1 Steelers by 17 points. Pittsburgh was a massive node — ranked #2 with a 5.00 — and Baltimore took a 17-point chunk of that. One dominant win over the most dominant team in the league pumped an enormous amount of score through the graph. PageRank working exactly as designed: rewarding quality over quantity. But the playoffs told a different story — Baltimore lost, and by the time we recalculate PageRank through the conference championships, the Ravens had dropped to 4.36 while Pittsburgh surged to 7.25, reclaiming the top spot.
The 2010 Browns were 5-11 and ranked #2. Peyton Hillis and the Cleveland Browns won five games that year. One of them was a 34-14 demolition of the Patriots, who finished the season ranked #1 with the highest score in that year’s graph (4.65). That single win catapulted a terrible team to the second-highest PageRank in the league. The year before? #25. The year after? Dead last. PageRank doesn’t care about your record — it cares about who you beat and by how much.

The 2015 Falcons were 8-8 and ranked #2. They beat the 14-0 Panthers by 7, spoiling Carolina’s undefeated season. One upset over the best team in the league transferred a massive chunk of PageRank. The transitive property at work — beat the team that beat everyone, and you inherit a share of everyone they beat too.
Baltimore is the algorithm’s favorite franchise. The Ravens finished #1 in regular season PageRank six times (2004, 2006, 2011, 2019, 2023, 2024) — more than any other team. No other franchise has more than three. And yet, Baltimore has zero Super Bowl appearances from the #1 position. The model keeps crowning them, and they keep letting the model down.
The 2022 Chiefs won the Super Bowl ranked #11. 14-3 record, but their wins just weren’t impressive by PageRank standards. They won anyway, because Mahomes. Sometimes the algorithm can’t account for a generational talent just deciding to win.
2025: the NFC West dominates. LA Rams and Seattle are 1-2, with San Francisco at #3. Three-quarters of a division in the top three is unusual.
What’s next
The 2004 Ravens, the 2010 Browns, and the 2015 Falcons all expose the same blind spot: a single blowout win over the right opponent can inflate a mediocre team’s PageRank beyond what feels reasonable. The model is technically correct — they did beat those teams by those margins — but it’s missing context that would help separate signal from noise.
Backup QB wins. Did the 2010 Browns beat the real Patriots, or did they catch a bad week? Beating the 12-4 Chiefs without Mahomes isn’t the same as beating them with him. If the starting QB didn’t play, reduce the edge weight. The win still counts, just worth less.
Late-season games against resting starters. The 2009 Panthers beat both New Orleans and Minnesota in the final weeks — but both teams had likely clinched playoff spots and were resting starters. Those wins inflate Carolina’s PageRank artificially. Same discounting approach: detect “rubber match” situations and reduce edge weights.
Context bonuses. Division wins should be worth slightly more (teams know each other, game-plan harder). Road wins too (winning away is harder). Small multipliers that stack.
All of these use the same pattern: edge_weight = margin * multiplier. The infrastructure is there. It’s a matter of sourcing the data — clinch dates, snap counts, game location — and tuning the multipliers against 25 seasons of Super Bowl results.
The takeaway
Win-loss records lie. Point differential lies less, but still can’t see who you beat. PageRank captures something neither of those can: the recursive, transitive strength that flows through a season’s worth of results.
So now, when someone tells me “Yeah, but the Vikings haven’t beat anyone this year!”, I have the data to back them up…
All game data sourced from nflverse — an incredible open-source project that makes NFL data accessible to everyone. Thank you to the maintainers and contributors.
SEA 27 - NE 24
Moneyline: Seattle (SEA -238 / NE +195)
ATS: NE +4.5
Props: There will be a DST TD